

Sydney Is Among Most Walkable Cities of 2025 in survey
A new report by Compare the Market AU has analysed walking trails, safety scores, public transport costs and other relevant factors to reveal the best cities to live in and move around easily without a car.
The study placed Sydney above cities like London, Berlin, and New York. The full dataset is at the end of the email.
Key Highlights for Sydney:
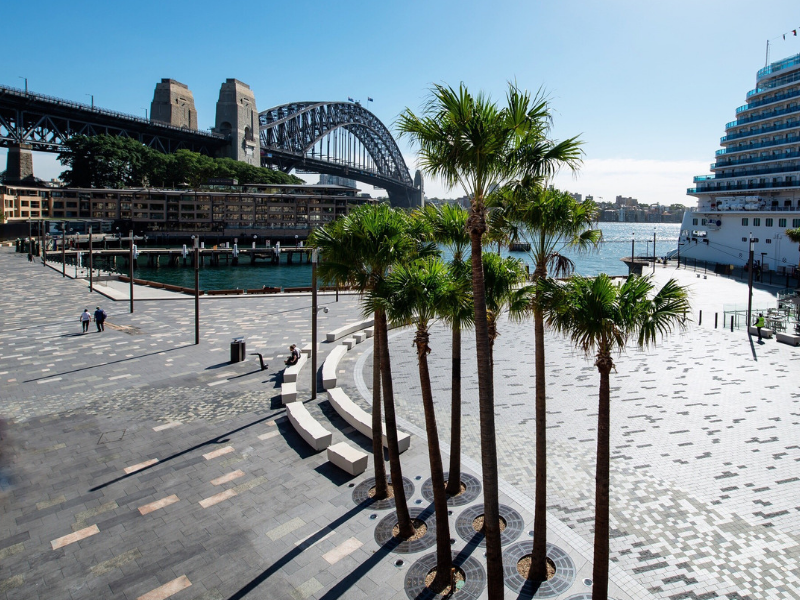
- Walking Trails: Sydney boasts an impressive 667 walking trails, ranking among the highest globally and reinforcing its reputation as a walkable city.
- Public Transport: With a ticket price of AUD 5.14and a public transport score of 62.3%, Sydney demonstrates a commitment to efficient commuting options.
- Bike Infrastructure: While cycling infrastructure in Sydney still lags behind its European counterparts, the city’s active transport initiatives continue to expand.
- Sustainability & Accessibility: 49% of Sydney’s population lives near essential services, highlighting the city’s progress in reducing car dependency.
How Sydney Compares Globally
| Rank | City | Country | Bike Trail Distance (km) | Number of Walking Trails | Safety Score | Public Transport Ticket (AUD) | Public Transport Score | Avg Monthly Rainfall (mm) | Car Free Places | People Near Services | Total Score |
| 1 | Munich | Germany | 1,468,623.00 | 41 | 78.89 | 6.31 | 61.70% | 83.3 | 86% | 85% | 5.297 |
| 2 | Milan | Italy | 1,941,010.00 | 10 | 48.45 | 3.74 | 60.30% | 97 | 62% | 80% | 4.934 |
| 3 | Warsaw | Poland | 108,238.00 | 22 | 73.68 | 1.73 | 60.90% | 58 | 74% | 75% | 4.902 |
| 4 | Helsinki | Finland | 320,647.00 | 116 | 75.42 | 5.26 | 71.60% | 60.8 | 85% | 60% | 4.84 |
| 5 | Paris | France | 972,734.00 | 59 | 42.13 | 3.58 | 68.20% | 60 | 61% | 85% | 4.776 |
| 6 | Tokyo | Japan | 155,513.00 | 264 | 75.98 | 2.11 | 64.80% | 123.5 | 48% | 77% | 4.761 |
| 7 | Madrid | Spain | 77,274.00 | 35 | 73.16 | 2.55 | 56.00% | 34.6 | 68% | 76% | 4.74 |
| 8 | Oslo | Norway | 630,328.00 | 69 | 66.79 | 6.01 | 67.00% | 84 | 76% | 78% | 4.639 |
| 9 | Copenhagen | Denmark | 351,578.00 | 36 | 73.79 | 5.47 | 73.10% | 61 | 77% | 60% | 4.61 |
| 10 | Amsterdam | Netherlands | 1,090,608.00 | 60 | 71.53 | 5.77 | 63.70% | 70 | 68% | 52% | 4.538 |
| 11 | Sydney | Australia | 41,938.00 | 667 | 65.74 | 5.14 | 62.30% | 76 | 49% | 43% | 4.503 |
| 12 | Stockholm | Sweden | 355,027.00 | 87 | 54.05 | 6.34 | 72.50% | 52 | 79% | 67% | 4.423 |
| 13 | Berlin | Germany | 92,242.00 | 89 | 55.79 | 5.44 | 65.80% | 55.8 | 72% | 77% | 4.336 |
| 14 | Seoul | South Korea | 120,632.00 | 141 | 75.49 | 1.66 | 62.90% | 102.8 | 33% | 61% | 4.274 |
Topping the list was Munich, Germany, followed by Milan, Italy, and Warsaw, Poland. Other high-performing cities included Tokyo, Paris, and Madrid. While Sydney outperformed major global hubs such as Berlin (13th), London (18th), and New York (34th), there remains room for improvement in areas such as bike-friendly infrastructure and car-free spaces.
Melbourne, the only other Australian city in the top 20, ranked 17th globally, strongly performing in public transport and pedestrian-friendly spaces.
General Manager of Money at Compare the Market, Stephen Zeller, states that access to everything from healthcare and educational services to amenities such as parks, cafes, and libraries, has an impact on house buying.
“Looking at transport and amenities is a crucial step of assessing a potential home,” Zeller explains.
“That means looking at the public transport links, and seeing how far away your nearest stop is, what time they run to, and frequency; as well as identifying routes that you feel safe walking.”
“Keep in mind more desirable areas will generally cost more, which means you might need a bigger home loan than you were originally budgeting for. Using a borrowing power calculator and getting property reports can help with budget planning when it comes time to find a house to buy.”
To find out more about the research, please visit: https://www.comparethemarket.
ENDS
| Rank | City | Country | Bike Trail Distance (km) | No of Walking Trails | Safety Score | Public Transport Ticket (EUR) | Public Transport Score | Avg Monthly Rainfall (mm) | Car Free Places | People Near Services | Total Score |
| 1 | Munich | Germany | 1,468,623.00 | 41 | 78.89 | 3.79 | 61.70% | 83.3 | 86% | 85% | 5.297 |
| 2 | Milan | Italy | 1,941,010.00 | 10 | 48.45 | 2.25 | 60.30% | 97 | 62% | 80% | 4.934 |
| 3 | Warsaw | Poland | 108,238.00 | 22 | 73.68 | 1.04 | 60.90% | 58 | 74% | 75% | 4.902 |
| 4 | Helsinki | Finland | 320,647.00 | 116 | 75.42 | 3.16 | 71.60% | 60.8 | 85% | 60% | 4.84 |
| 5 | Paris | France | 972,734.00 | 59 | 42.13 | 2.15 | 68.20% | 60 | 61% | 85% | 4.776 |
| 6 | Tokyo | Japan | 155,513.00 | 264 | 75.98 | 1.27 | 64.80% | 123.5 | 48% | 77% | 4.761 |
| 7 | Madrid | Spain | 77,274.00 | 35 | 73.16 | 1.53 | 56.00% | 34.6 | 68% | 76% | 4.74 |
| 8 | Oslo | Norway | 630,328.00 | 69 | 66.79 | 3.61 | 67.00% | 84 | 76% | 78% | 4.639 |
| 9 | Copenhagen | Denmark | 351,578.00 | 36 | 73.79 | 3.29 | 73.10% | 61 | 77% | 60% | 4.61 |
| 10 | Amsterdam | Netherlands | 1,090,608.00 | 60 | 71.53 | 3.47 | 63.70% | 70 | 68% | 52% | 4.538 |
| 11 | Sydney | Australia | 41,938.00 |